The crisis in housing is based on housing costs rising faster than inflation and wages. A standard metric of housing expenses (mortgage/rent and utilities) is spending 30% of your annual income in rent. More than half of renters in many communities studied are paying more than 30% of their income in housing costs. Many places served by a blue-collar population simply aren’t affordable to those providing the services.
As Architects working with projects funded by Low Income Housing Tax Credits and other programs designed to provide housing for all, we’ve experienced the stigma that “affordable” housing faces in our communities. We’ve consistently found a communication gap between the perception of this type of housing, the communities that they’re located in and the community this type of housing serves. The terminology we use must change to be more reflective of the reality of these communities and not the stereotypes.
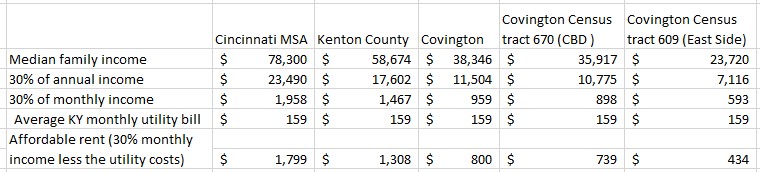
The litmus of affordability starts with household income. In Covington, the median income is $38,307, and in Newport, the median income is $33,008. The median income in Covington’s central business district is $35,917 and in the Eastside neighborhood it’s $23,720. Using the 30% rule, average individuals in these communities can afford rents between $593 and $897. In northern Kentucky, school teachers average $52,420, firemen average $51,664, construction workers average $28,588, the hospitality industry make $26,928 on average. The average income for college graduates entering the workforce is $51,022. The average wage for a warehouse worker at an Amazon distribution center is $27,000 per year. Rents for these individuals would fall in this range: $673-1311. With hospitality workers being able to afford the low end, and school teachers on the higher end.
For individuals to qualify for housing built to be “affordable” here, incomes must be less than 80% of the median incomes. In Covington this is $30,645, and in Newport $26,406. Using the 30% rule, “affordable” housing are rents in the $660 - $766 range.
The apartments in Duveneck Square range from $1075-1820 for a studio or 1BR, River’s Edge apartments range from $996-1073 for a studio or 1BR and Roebling Row ranges from $1486-1925 for a 1-2BR. Using the same 30% rule of thumb, these studio and one bedroom apartments serve those who make between $35,856 and $69,300; well outside the averages of the communities they are in!
The point is not intended to discourage new housing development, but to avoid a crisis in housing where what is provided is out of reach of most of the community. These considerations are important issue for all of us. As population and demand grow, the median lines of income and rent are going to shift, impacting those in the middle of our diverse communities the most.
In addition to restructuring the terminology used, affordable housing must also become a regional issue. It is simply not enough to just build housing that people can afford, we must consider the entire ecosystem of the individual. Primary in this system is transportation - whether it is public or private, people need to get from their place of residence to their work, their school, their doctors, their food sources, etc. Often, interruption of access to any of these leads to a crisis in an individual’s housing. In addressing housing for all demographics, we must also address accessibility to everything else. We must provide housing regionally in the places where access to work, education and healthcare is easiest. We must also address public transportation as a tool for broader access to housing options. For example, some of the lowest cost housing is in Covington and Newport, but new work centers are forming in Burlington and Hebron, near the airport. And there are no convenient or simple transportation options linking the two.
How much do you make? How much does your neighbor make? Is it a lot more than that? How much do you pay in rent? It is important in our discussions of providing affordable housing, we truly understand the populations being served – by the story of the person, what they do, how much they make and how big their family is. Let’s start by comparing that with census data that describes our communities and understand how similar we all really are. Let’s start by removing the stigma.
Next week’s blog we’ll continue to discuss this topic as it relates to gentrification. Stay tuned - we want to hear what you think!